# How to Create and Save a Segmentation Report
Enterprise Analytics in **DoubleTick** now comes with a **new and powerful feature** — the ability to **create, save, and reuse reports**.
Earlier, every time you opened Enterprise Analytics, you had to **recreate reports from scratch**. There was no way to save a report and simply view updated data later.
👉 **That limitation is now solved.**\
You can now **create a report once, save it, and reuse it anytime** to view fresh, updated data.
This article explains **step by step** how you can create and save a report for future use.
***
### What’s New in Enterprise Analytics?
With this new feature, you can:
* Create a custom report once
* Save the report configuration
* Reopen the same report anytime
* Automatically see **updated data** without rebuilding the report
***
### Step-by-Step: How to Create a New Report in Enterprise Analytics
***
#### Step 1: Log in to Your DoubleTick Account
1. Log in using your **registered WhatsApp number**.
2. Verify your login using **OTP**.
***
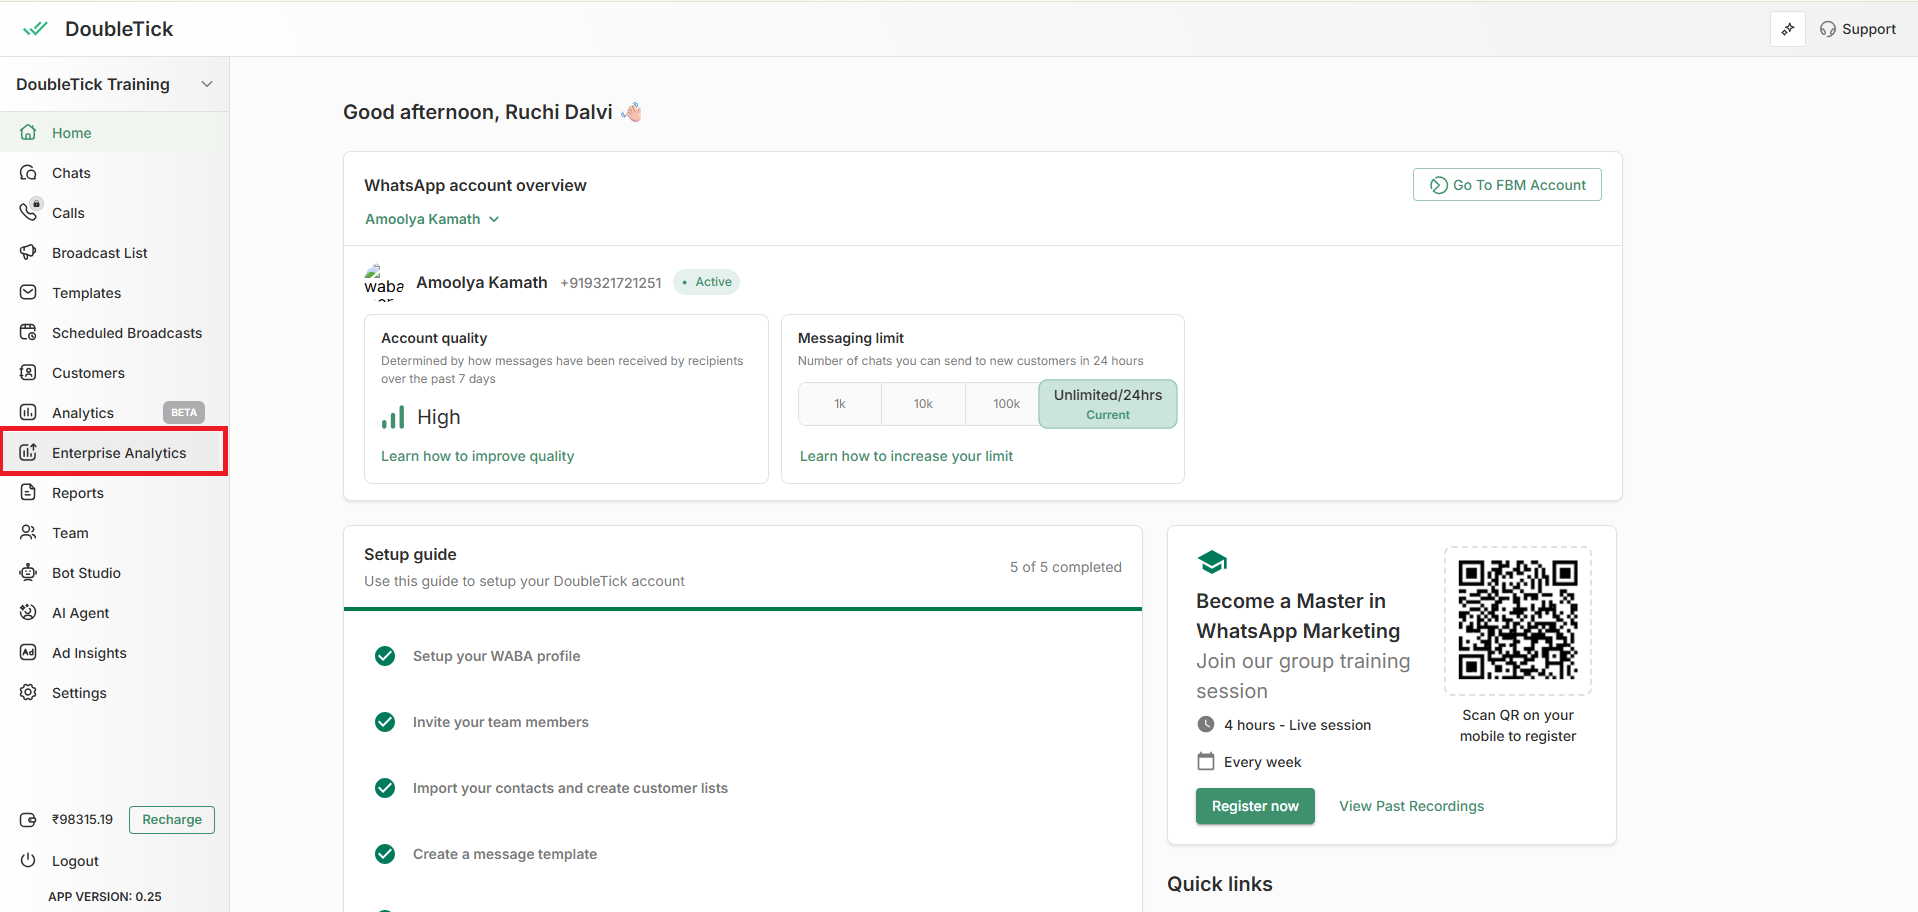
#### Step 2: Open Enterprise Analytics
1. Hover on the **left-side navigation bar**.
2. The navigation panel will expand.
3. Click on **Enterprise Analytics**.
***
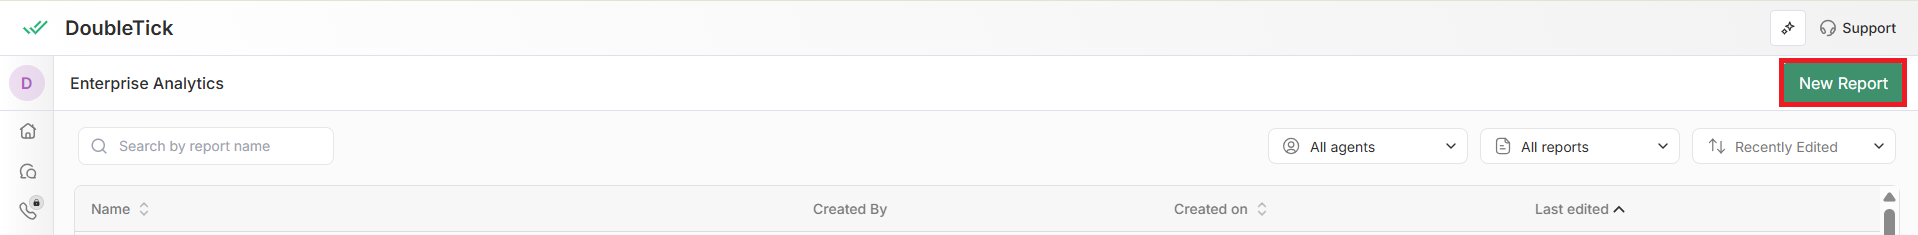
#### Step 3: Click on “New Report”
1. On the **top-right corner**, you’ll see a **green button** labeled **New Report**.
2. Click on **New Report**.\
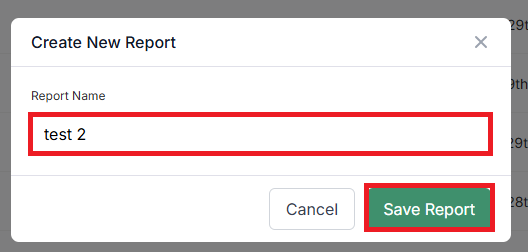
3. Enter a report name (for example: *Test Report 2*).
4. Click **Save Report**.
You will now enter the **report setup screen**.
***
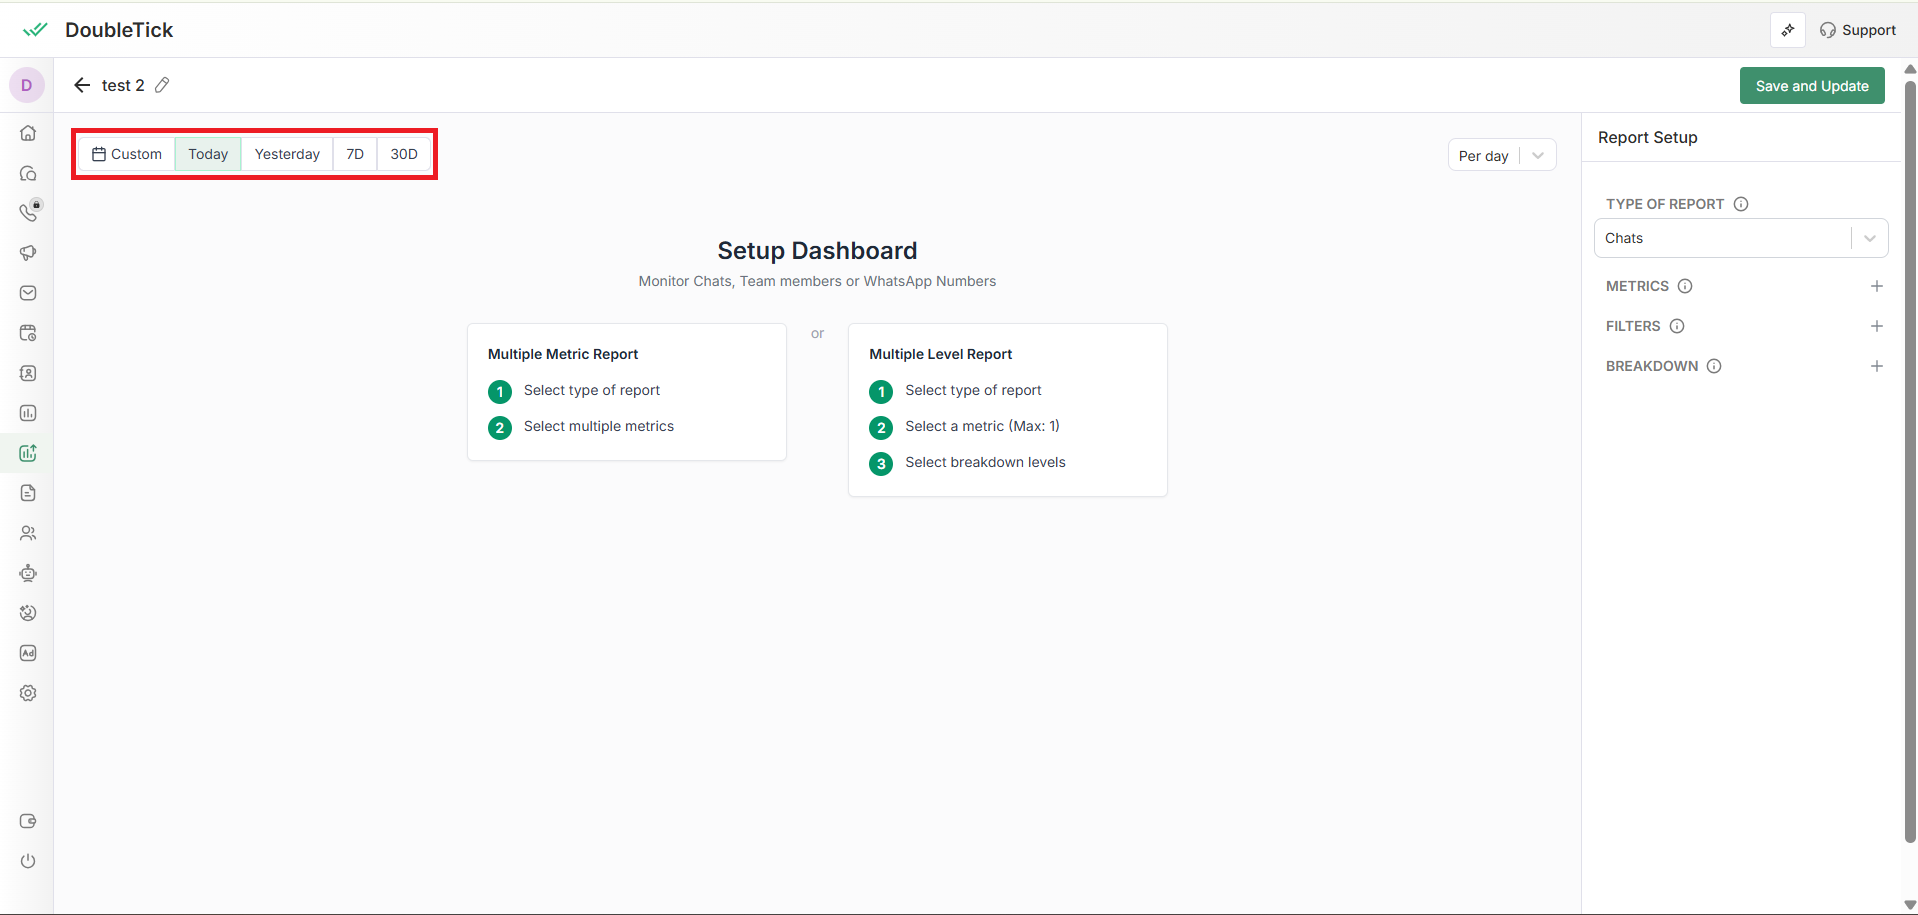
### Step 4: Choose the Time Range
Below the report name (top-left corner), you’ll see **Time Range options**.
Available options:
* Today (default)
* Yesterday
* Last 7 Days
* Last 30 Days
* Custom
#### Using a Custom Time Range
If you have a custom requirement:
1. Click on **Custom**
2. Select the required range (for example: last 30 days, last 90 days, etc.)
3. Apply the custom time range
***
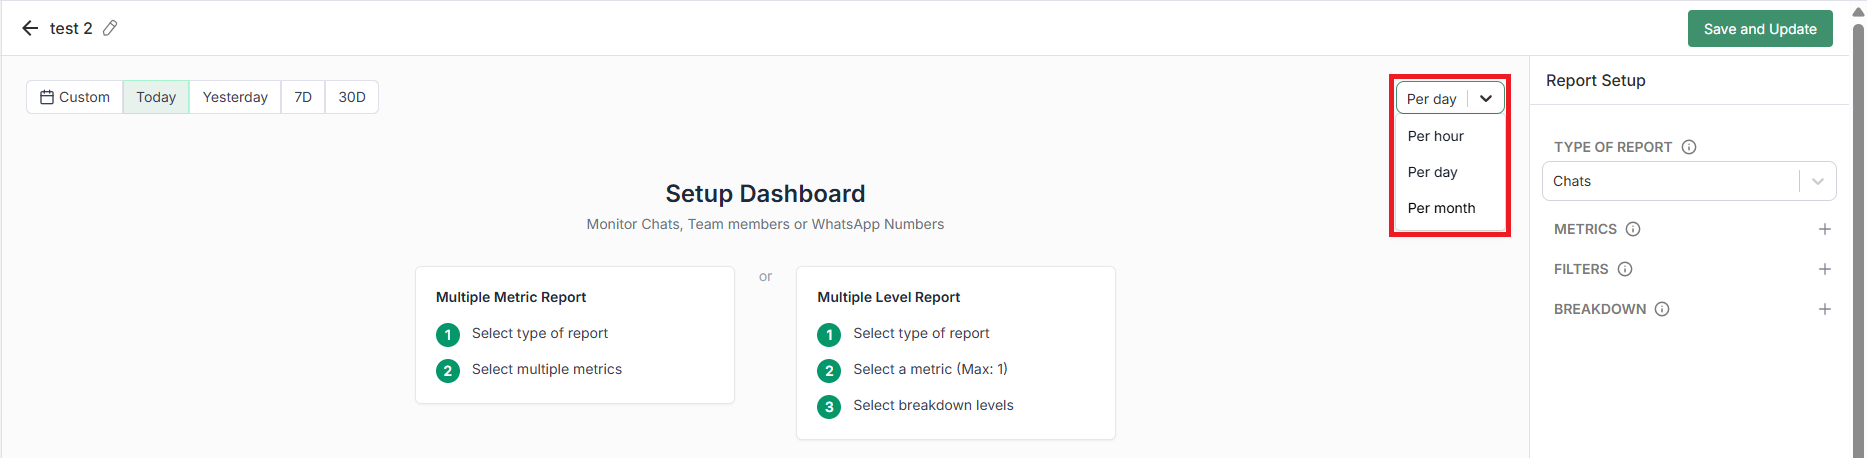
#### Step 5: Choose How the Report Should Be Presented
Right next to the time range selector, you’ll see a **presentation dropdown**.
You can choose:
* **Per hour**
* **Per day**
* **Per month**
***
### Option 1: Creating a Multi-Metric Report
A **multi-metric report** allows you to track **multiple KPIs at once**.
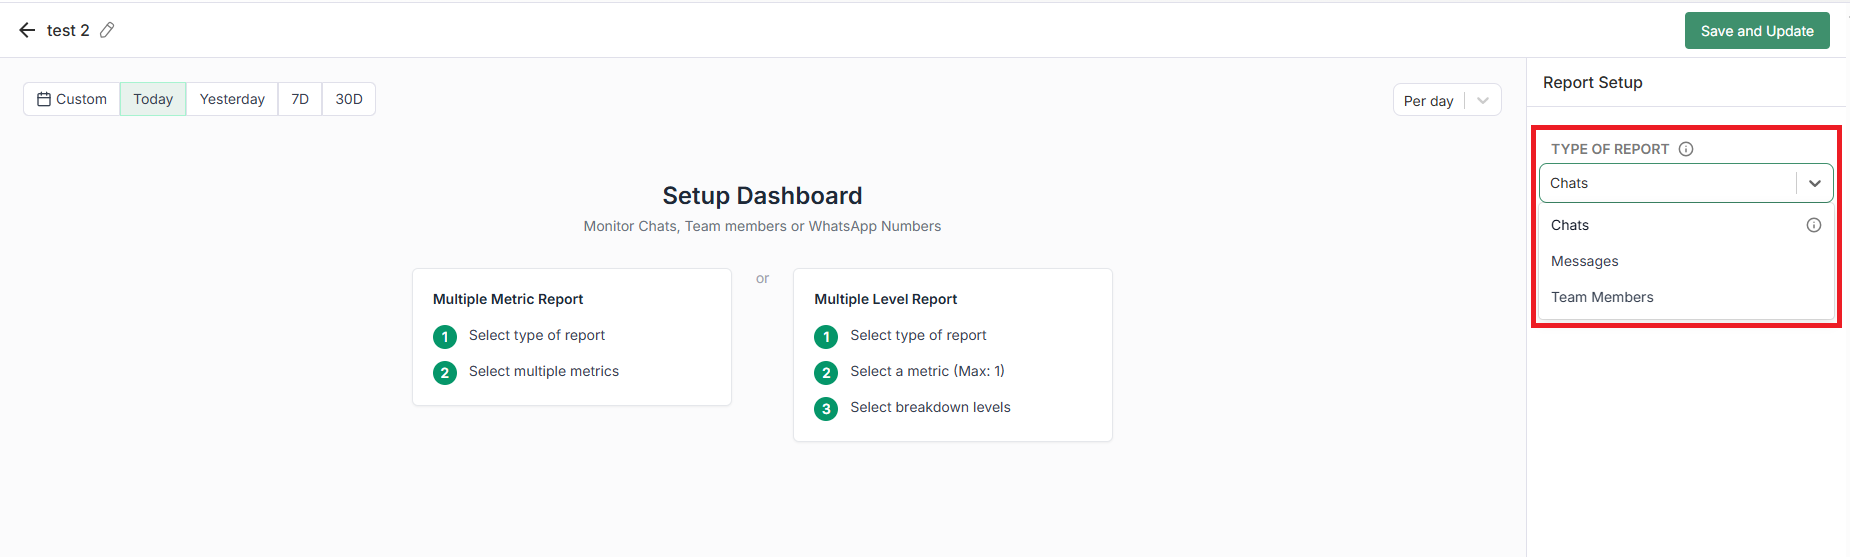
#### Select the Type of Report
You’ll first need to choose the **Type of Report**.\
There are **three options**:
1. **Chats**\
Tracks performance and metrics at the **conversation level**
2. **Messages**\
Analyzes **message volume, frequency, and message nature**
3. **Team Members**\
Monitors **agent activity, workload distribution, and team efficiency**
***
#### Select Metrics
On the right side, under **Metrics**, click the **➕ (plus) icon**.
You’ll see a list of available metrics, such as:
* New Chats
* Active Chats
* Waiting at Day End
* Awaiting Agent Reply
* SLA Breached Chats
* Average Response Time
* First Response
* Average First Response Time
* Irritated Chats
* Chats with 1 / 5 / 10 customer messages
***
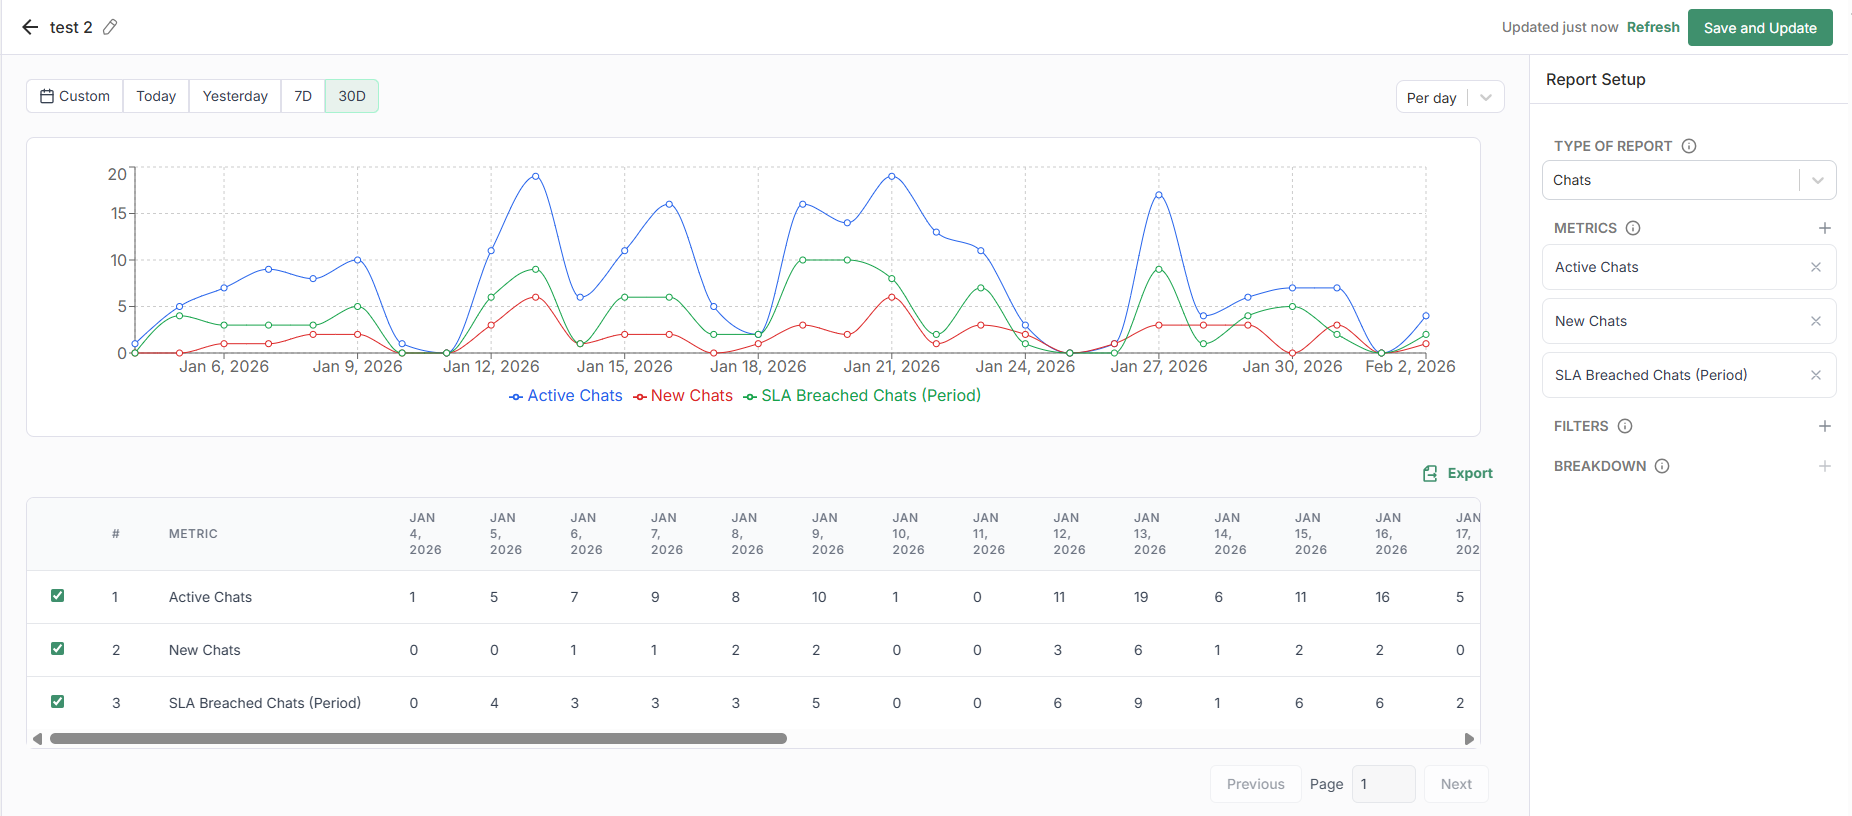
#### What You’ll See in the Report
* A **day-wise graph** for the last 30 days
* Numeric values shown **below the graph**
* Separate rows for:
* New Chats
* Active Chats
* SLA Breached Chats
This helps you clearly understand **daily trends and performance**.
***
#### Exporting the Report
Above the numeric data section, you’ll find an **Export** button.
Click it to:
* Download the report
* Export the data into an **Excel file**
* View day-wise numbers outside DoubleTick
***
### Option 2: Creating a Multi-Level Report
A **multi-level report** allows you to:
* Select **one metric**
* Break it down into **multiple levels (dimensions)**
***
#### Select the Type of Report
Again, choose one of the three options:
* Chats
* Messages
* Team Members
👉 For this example, select **Messages**.
***
#### Select a Metric
From the metrics list, select **one metric**, such as:
* Total Messages
* Incoming Messages
* Outgoing Messages
* Irritated Messages
👉 Example: Select **Incoming Messages**.
***
#### Choose Breakdown Levels
Now you can break the metric into different levels:
* WhatsApp Numbers
* Services
* New vs Returning Customers
This will show:
* Graphical representation
* Numeric breakdown for each day
👉 Example insight:\
On **5th Jan**, how many incoming messages came from:
* New customers
* Returning customers
***
#### Drill Down to Message-Level Details
* Click on any number in the report (for a specific date).
* A detailed report opens showing:
* Timestamp
* WABA name
* WABA number
* Customer number
* Message content
To open the actual chat:
* Click **View**
* The conversation window opens directly
***
#### Exporting Multi-Level Reports
Just like multi-metric reports:
* Click **Export**
* Download the data in **Excel format**
***
### Save and Reuse the Report
Once your report is ready:
1. Click **Save and Update** (top-right corner).
2. Your report is now saved.
***
### Viewing the Report in the Future
The biggest advantage of this feature 👇
* After 15 days, 30 days, or anytime later
* Open **Enterprise Analytics**
* Select your **saved report**
* The **latest updated data automatically loads**
No need to recreate the report again 🎉
***
### Final Summary
With the new **Saved Reports** feature in Enterprise Analytics, you can:
* Create reports once
* Save them for future use
* Instantly access updated analytics
* Export reports anytime
* Analyze performance without repetitive setup
This makes Enterprise Analytics **faster, smarter, and future-ready** for all DoubleTick customers.
.gif?alt=media&token=6467f992-f5fc-4bd1-81ed-32539dd1c2a5)
.gif?alt=media&token=0481f119-a23d-4c2b-8d53-92a16de2320d)
.gif?alt=media&token=aa6cd5e9-45ec-4305-9535-9488e80c91b6)
.gif?alt=media&token=124baba4-ba3b-428f-a536-8ff514d84f6c)
.gif?alt=media&token=34a9b45f-9dae-4d80-9b1d-3449dc6fe090)
.gif?alt=media&token=a6de62b0-bbf2-4fe2-bec2-bb738308984f)